Introduction
-
Indian Multinational IT Services: Established in 1990, Persistent Systems is a major player in the Indian IT industry, with a global presence.
-
Focus Areas: Their expertise lies in cloud computing, internet of things (IoT), endpoint security, big data analytics, and software product engineering services.
-
Publicly Traded: The company is listed on both the Bombay Stock Exchange (BSE) and National Stock Exchange of India (NSE).
-
Headquarters: Pune, Maharashtra, India.
They position themselves as a trusted Digital Engineering and Enterprise Modernization partner, helping businesses implement and modernize their operations https://www.persistent.com/
Chart Analysis
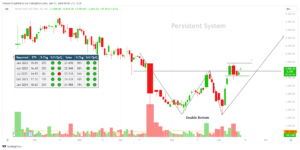
As you can see from the chart of the persistent system, it has formed a double bottom pattern and has already broken above its neckline. For the past four days, starting from June 10th, it has been consolidating above this neckline, indicating a potential trend reversal. This could be a very good opportunity. Furthermore, its EPS and sales data show consistent increases both sequentially and year-over-year/quarter-over-quarter.
Always prioritize risk management and proper position sizing to ensure you stay on track towards your goals. While analysis is valuable, it’s important to acknowledge that it may not always yield the expected results. Be prepared to adapt if things don’t go as planned, and maintain a resilient mindset throughout your journey.


Leave a Reply